Overview
A graphical exploration tool that makes disease-gene association data from the DisGeNET database accessible and navigable for researchers. Built in collaboration with a fellow student and professor at Northeastern.
Constructs interactive network graphs where nodes represent diseases or genes and edges represent known associations. Presented at Northeastern’s RISE ’24 poster presentations (first author).
Stack
Python
NetworkX
Plotly
Matplotlib
Pandas
DisGeNET API
Key Numbers
1M+
Associations
RISE
Presented ’24
3
Collaborators
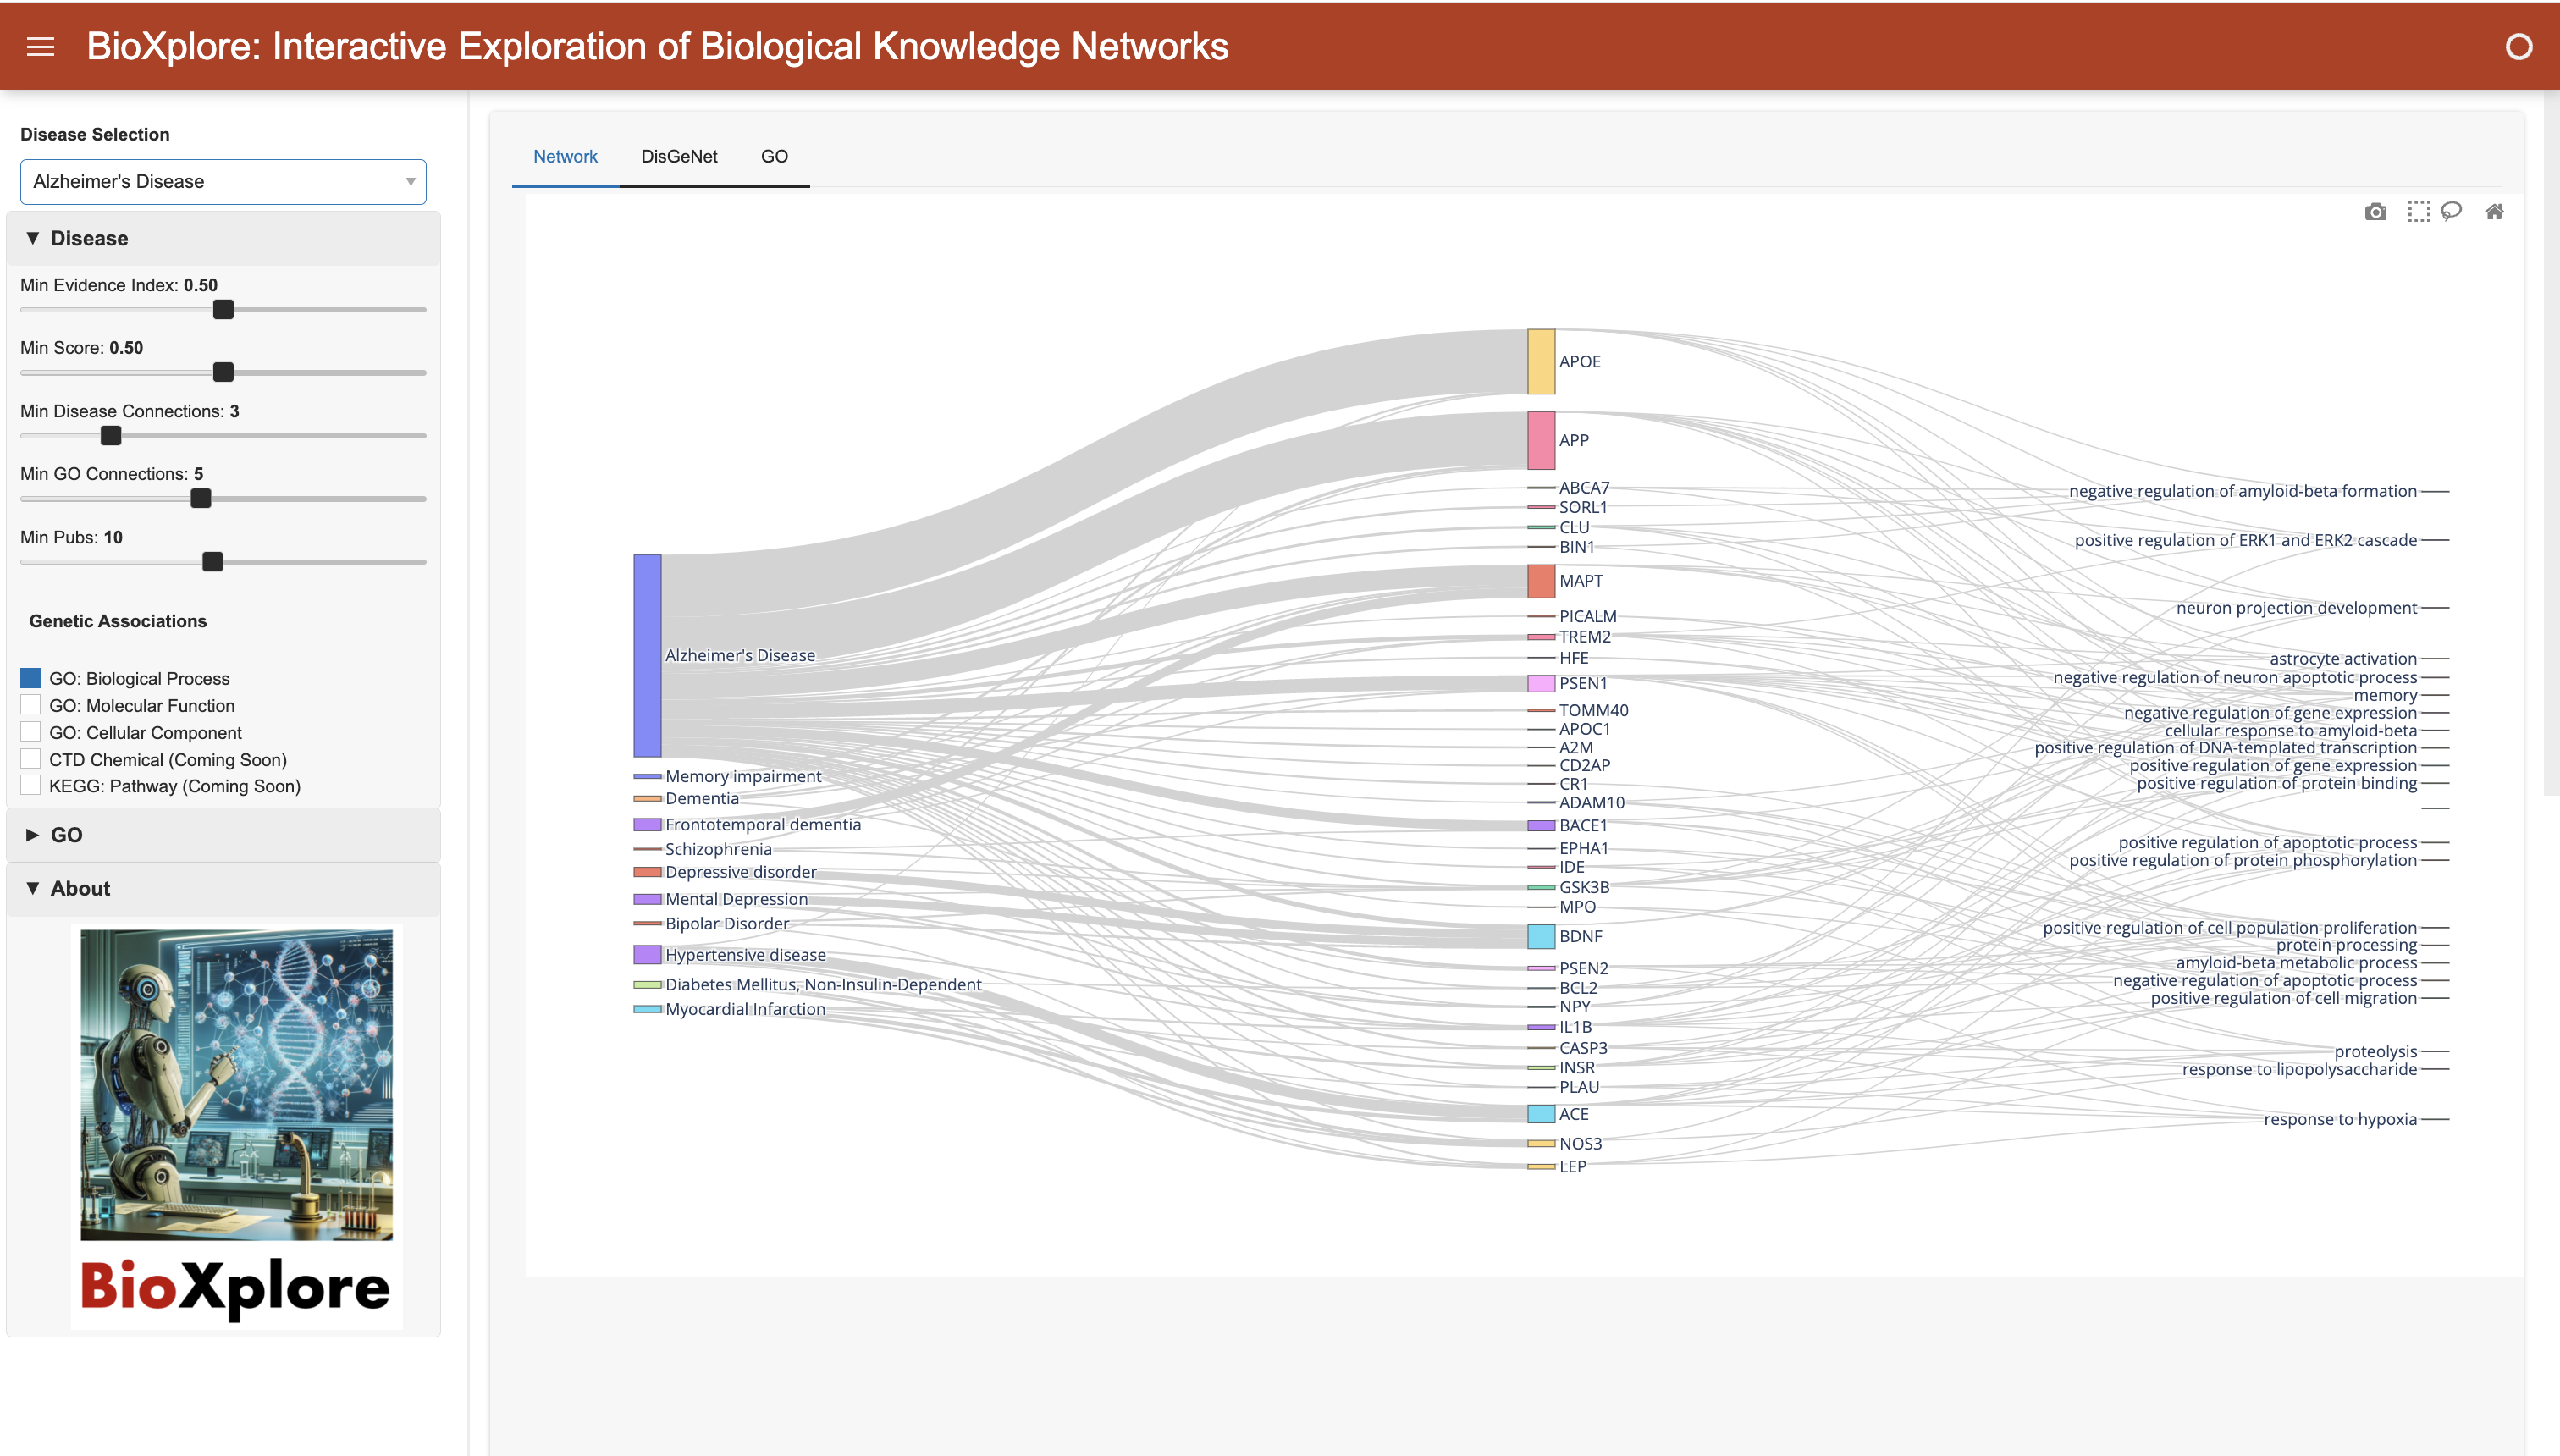
Dashboard — disease-gene association network explorer