Overview
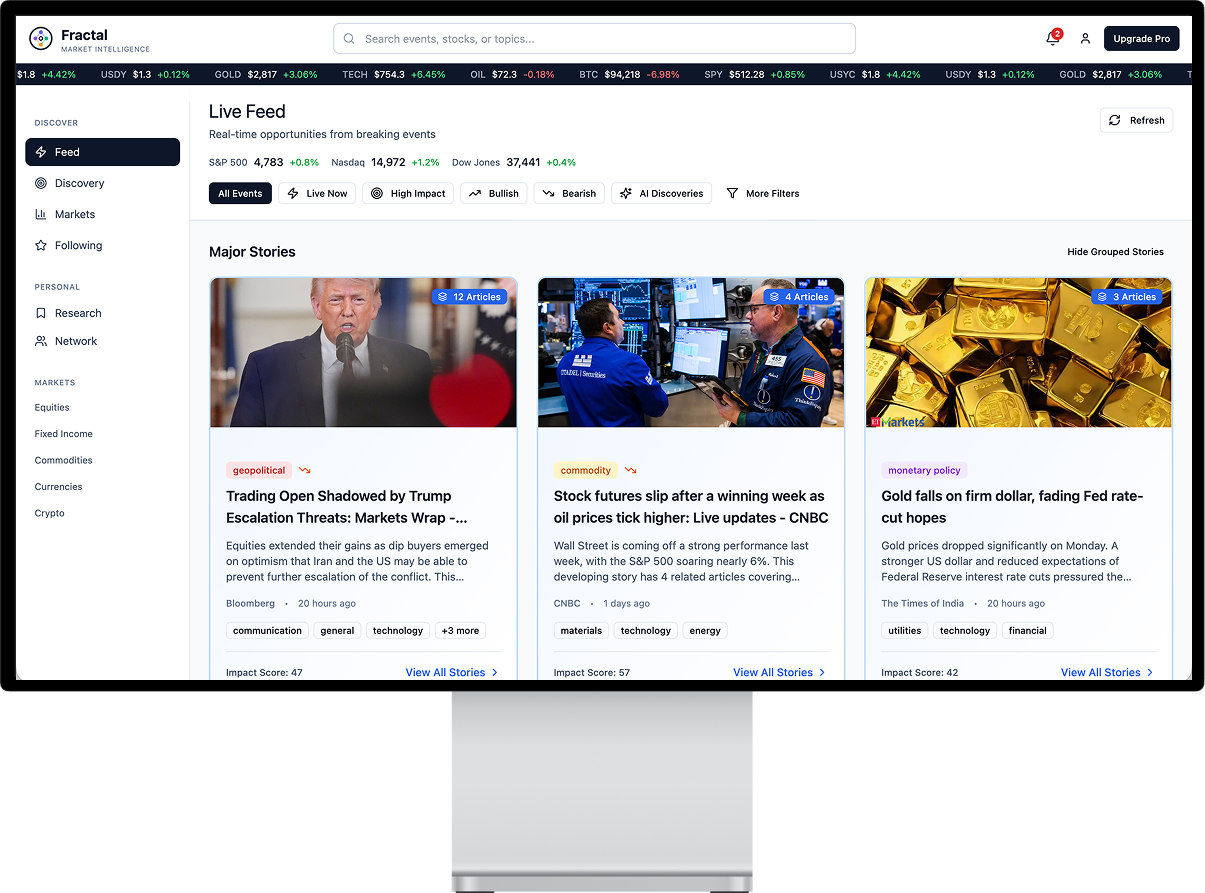
Fractal is a news exploration app that captures articles about world events via APIs and visualizes their downstream impacts on stocks. It helps users understand how real-world events move markets, making financial literacy more intuitive and accessible.
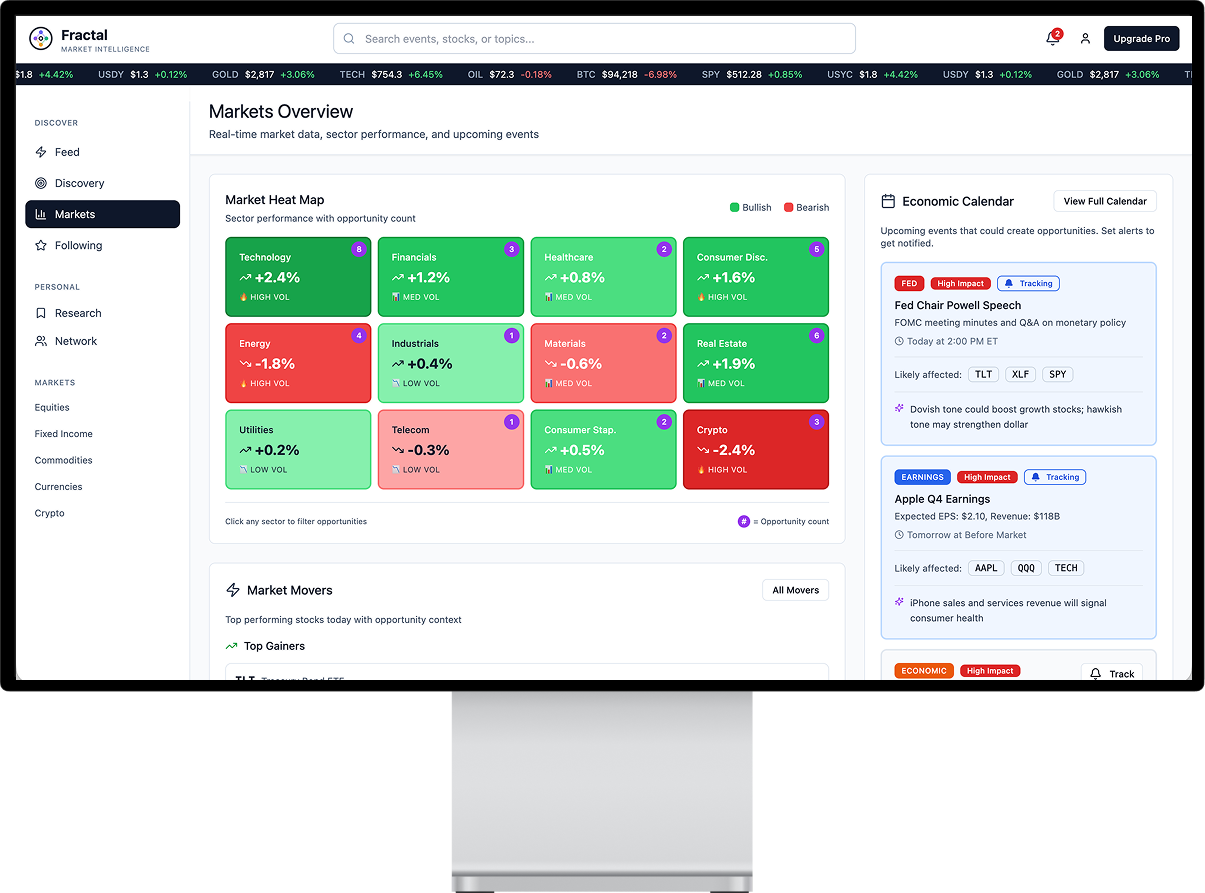
The design focuses on making complex financial data digestible through clear visual hierarchies and interactive data visualization.
The Concept
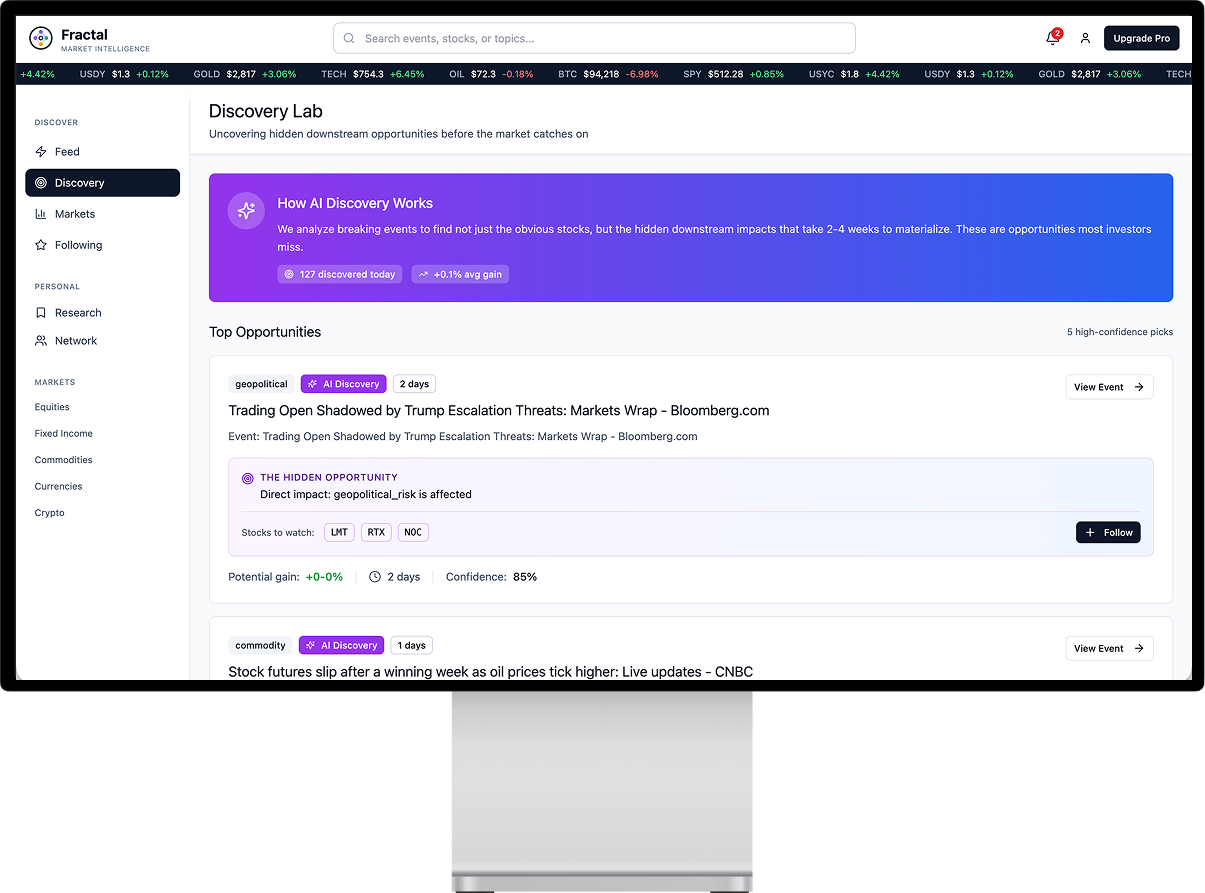
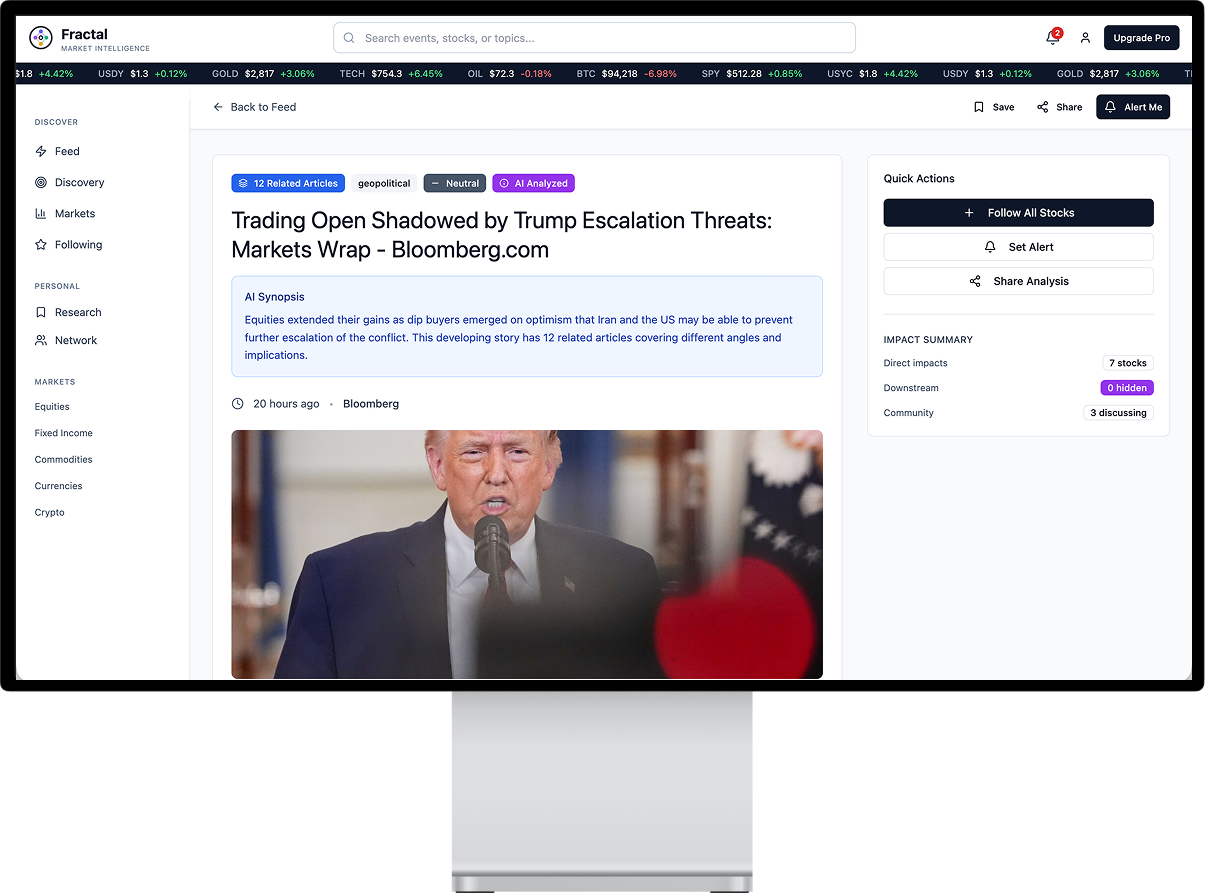
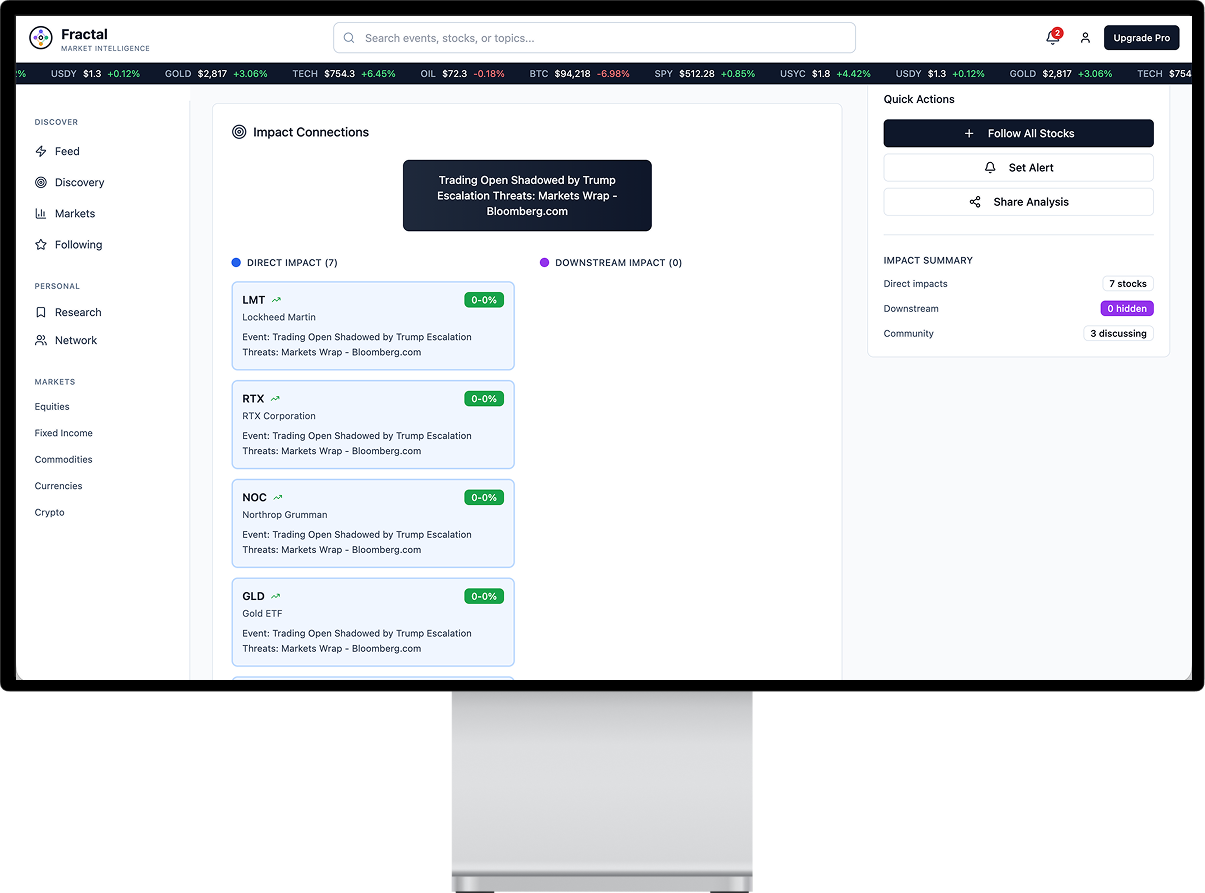
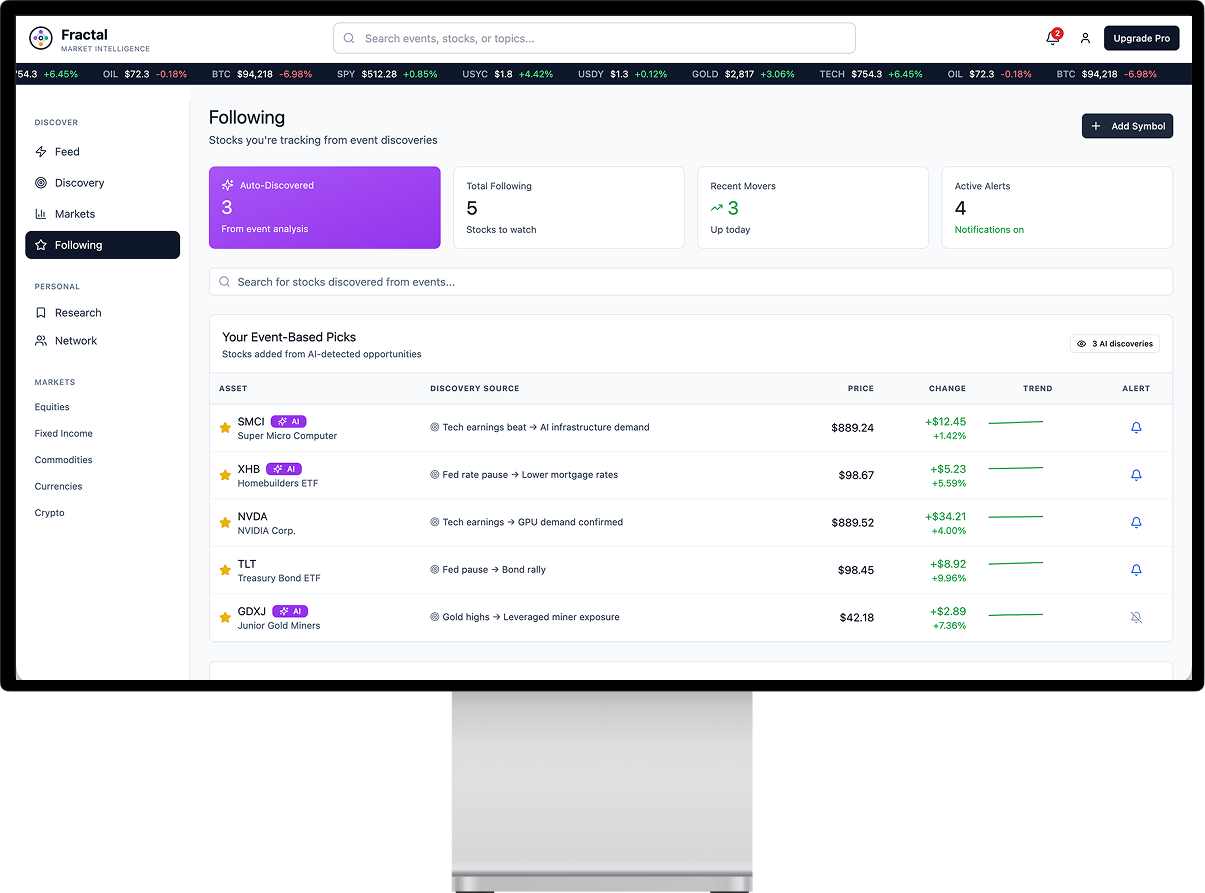
Most people read the news and check their stocks separately. Fractal bridges that gap by showing the causal chain — an event happens, and you can immediately see which sectors and stocks are affected and why. It’s financial education through real-time context.
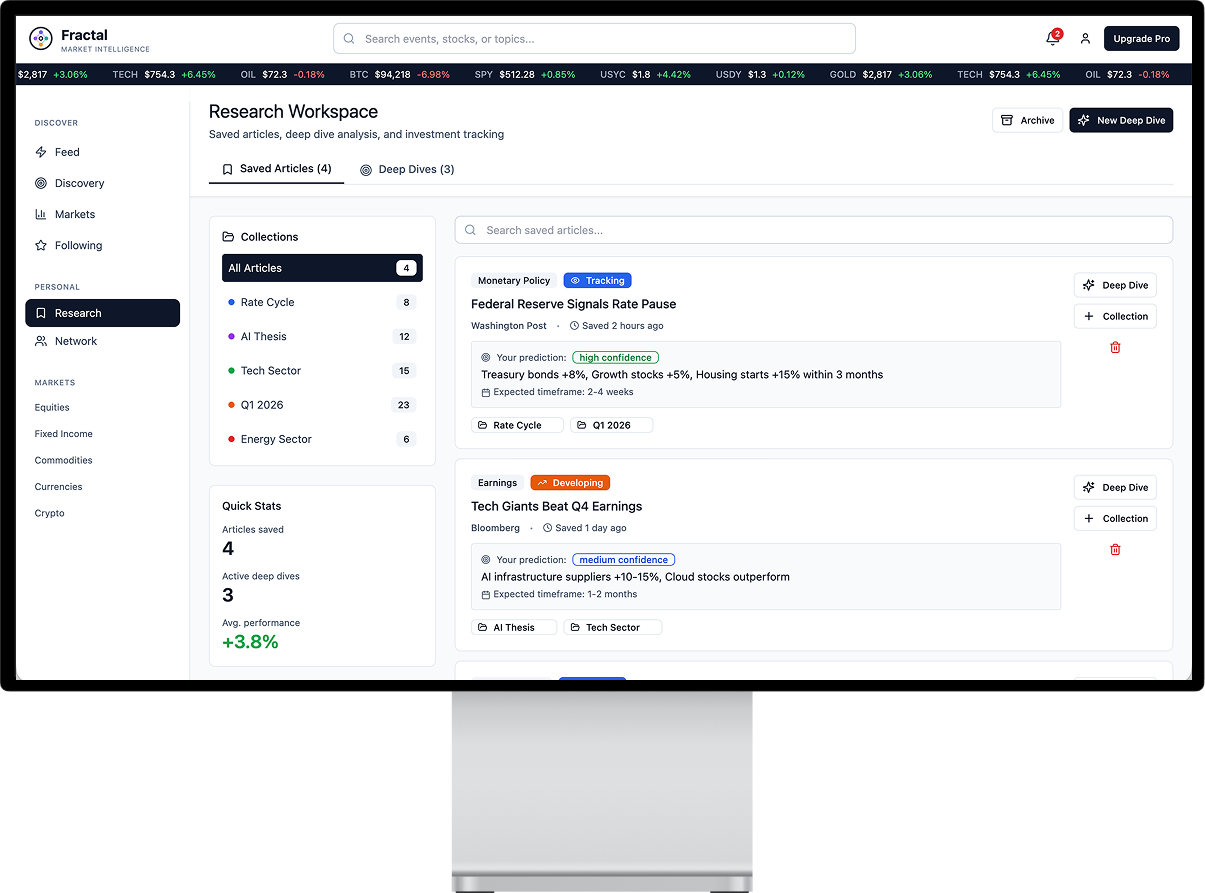
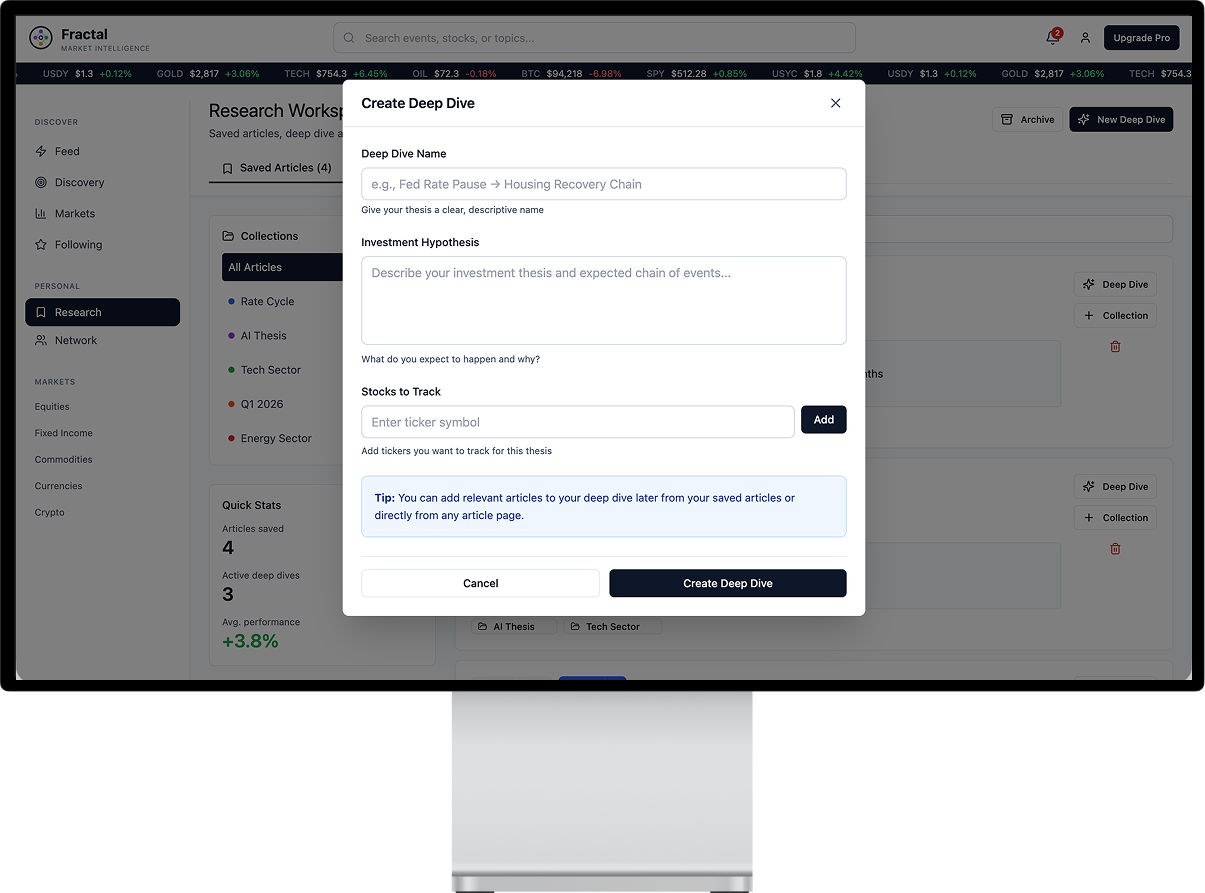
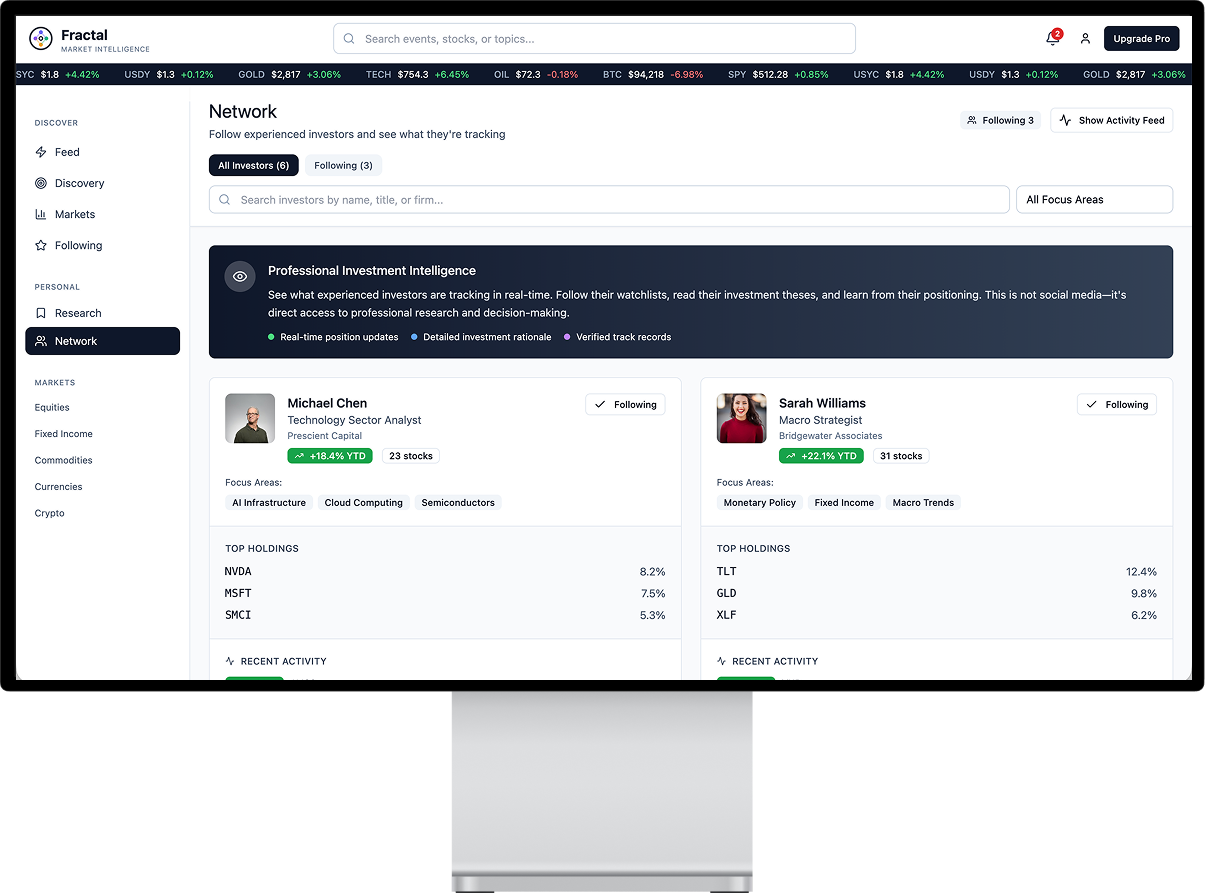
Design Approach
The interface balances information density with clarity. News articles sit alongside impact visualizations, with clear visual connections between events and their market effects. The color system uses warm accents against clean backgrounds to keep the data readable during extended use.